
Google Analytics Shows You Numbers. It Does Not Show You People.
Analytics, Website Visitor Identification, Lead Generation
Meta Title: Google Analytics Shows You Numbers. LeadSpyder Shows You People.
Meta Description: Google Analytics tells you how your site performs. LeadSpyder reveals who is on your site, what they did, and who sales should call. You already paid for the leads — here is how to see them.
Slug: https://leadspyder.ai/blog/analytics-blind-spots
Google Analytics Shows You Numbers. It Does Not Show You People.
You probably check Google Analytics every week. Sessions up, bounce rate down, traffic from organic looking healthy — nice! Then you close the tab and realize you still do not know who actually visited your site or who sales should call today.
That is the blind spot this post is about. Google Analytics is built for performance optimization, not sales prospecting. It shows you aggregate behavior, all anonymous by design. LeadSpyder adds the missing people layer, turning that same traffic into named, contactable leads you already paid for.
What Google Analytics Actually Shows You
Google Analytics 4 is excellent at what it was built to do. It reports on aggregate behavior across your site so you can improve performance and user experience. It is the industry standard for a reason, and marketers should absolutely keep using it.
- Sessions & users: How many visits you had and how many unique users came to your site.
- Engagement: Engagement rate, average engagement time, scroll depth, and events fired on each page.
- Traffic sources: Which channels drove visits — organic, paid, social, email, referral, and more.
- Pages & funnels: Top pages, drop-off points, and conversion events so you can improve flows.
- Basic demographics: Device category, location down to city/region, and high-level interests.
Used well, this data is gold for marketing optimization. You can tighten your funnel, improve content, and allocate budget to the channels that perform. But none of it tells you who any specific visitor is.
What Google Analytics Will Never Tell You (By Design)
There is a reason you cannot click a session in GA and see a name, email, or company. Google explicitly prohibits personally identifiable information (PII) in Analytics. The platform is architected around privacy and aggregate reporting, not individual identity.
- No visitor names, emails, or phone numbers — ever, per Google’s policies.
- No explicit company identity for visitors or account-level rollups for your target accounts.
- No way to see that one person who hit your pricing page four times this week and then your demo page yesterday.
- No signal that a specific buyer at a named company is now in “ready to talk” territory.
On top of that, GA4 undercounts traffic. Ad blockers, consent banners, and browser tracking prevention mean a chunk of your real visitors never show up in the numbers at all. Industry estimates put ad blocker impact at 25–40% of desktop traffic, and GA’s own consent mode documentation confirms it will miss users who opt out.
You are looking at beautiful charts about sessions and bounce rate while the actual people behind those numbers stay invisible to your sales team.
Same Traffic, Two Views: Analytics vs. LeadSpyder
Let’s put real numbers on the difference. Imagine last week your site had 1,432 sessions according to Google Analytics. Engagement looks solid, pricing is your top page, and organic search is the main driver. That is useful, but it is still anonymous.
Now look at that same traffic through LeadSpyder. From those 1,432 sessions, LeadSpyder identifies 280 named visitors — people and companies you can actually contact. That is a roughly 20–40% match rate on the traffic GA can see, plus additional visibility on some visitors GA never counted due to blockers and consent loss.
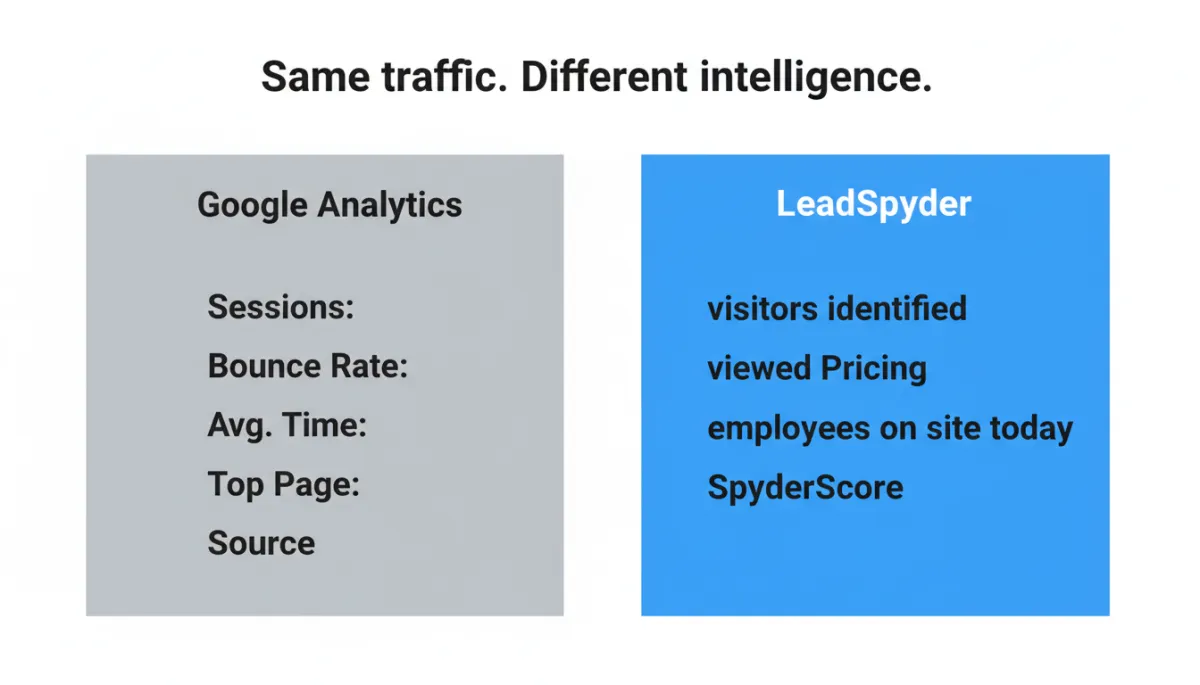
- Google Analytics view: “Sessions: 1,432. Bounce Rate: 61%. Avg. Time: 2:14. Top Page: /pricing. Source: Organic.”
- LeadSpyder view: “280 visitors identified. Sarah M. in Denver viewed Pricing 3x. TechCo Inc. had 4 employees on site today. SpyderScore 89.”
Both views describe the same week of traffic. One is analytics. The other is pipeline. You need both if you want to optimize performance and turn that performance into revenue.
The Behavior–Identity Gap: Why You Cannot Call a Session
GA4’s job is to answer “what happened?” It shows you that 61% of visitors bounced, that the average time on your pricing page was 2:14, and that organic search drove most of those visits. That is the behavior side of the story, and GA4 is very good at it.
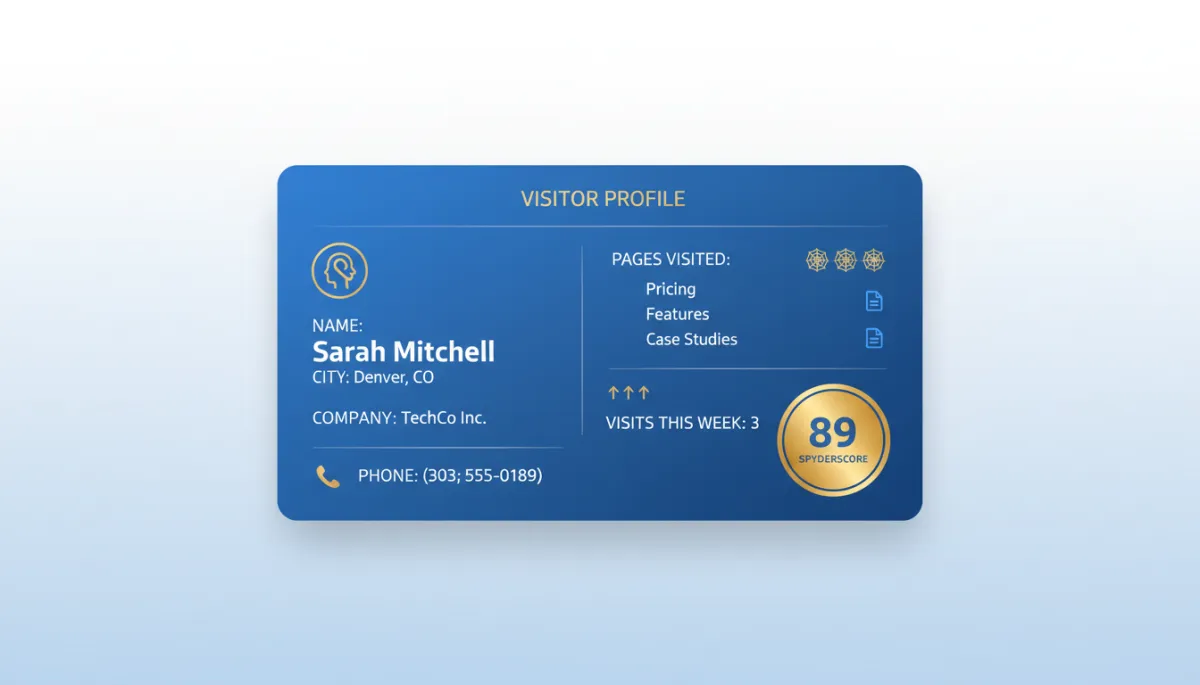
LeadSpyder fills the identity side. It matches real behavioral signals — page views, visit frequency, recency — against an identity graph. When there is a high-confidence match, you get a profile: name, company, city, contact details, pages viewed, and a SpyderScore to prioritize follow-up. When there is not, the visitor stays anonymous.
A Day in the Life: GA Session Report vs. LeadSpyder Queue
Picture last Tuesday. Your GA4 report shows 47 sessions, 12 from Google Ads, average engagement time of 3:42, and top page /pricing. You see 3 conversions from your contact form. You know your paid traffic is performing and your pricing page is doing work.
Now open your LeadSpyder dashboard for the same day. You see 9–19 named visitors matched from those 47 sessions. For each one you have first and last name, company, city, email, phone, pages visited, time on each page, visit history, and a SpyderScore. Your rep’s morning queue shows two HOT visitors (SpyderScore 80+), four WARM, and the rest COOL or COLD.
Both tools are right. GA told you the pattern: pricing is hot, Google Ads is working. LeadSpyder told you the people: who actually read pricing, who came back three times, and who is worth a call today. You cannot dial a session, but you can dial Sarah at TechCo.
Why GA’s User Count Understates Your Real Opportunity
GA4 counts a “user” as a device–identifier combination. If someone visits from a work laptop on Monday and a personal phone on Thursday, they might be counted as two users. For performance analytics, that is acceptable. For sales, it is misleading.
LeadSpyder’s identity graph can link those sessions back to a single person. The result is a unified profile that shows a complete research journey across devices. That same person who looked “COOL” on desktop (one quick blog visit) might be “HOT” on mobile (third visit, deep dive on pricing and case studies).
Without cross-device matching, you see two weak signals from two “different” users. With LeadSpyder, you see one strong signal from one real buyer with a SpyderScore of 89 and three visits this week. Your rep makes one well-timed call, with full context.
Using Google Analytics and LeadSpyder Together
This is not an either–or decision. Google Analytics and LeadSpyder are complementary. GA keeps you honest about how the site is performing overall. LeadSpyder makes sure you do not leave the best visitors invisible and untouched.
- Use GA to see which content drives the most high-intent behavior — visits to pricing, demo, and case study pages.
- Use LeadSpyder to see who followed those paths and to prioritize outreach based on SpyderScore and visit history.
- Use GA to optimize the experience for the 97–98% you will never identify.
- Use LeadSpyder to recover 20–40% of that same traffic as named, contactable people and hand them to sales.
You Already Paid for the Leads. Now See Them.
Every click you buy, every blog post you publish, every campaign you launch drives real people to your site. Your traffic already has names on it. You just cannot see them in Google Analytics. That is not GA’s job — and it never will be.
LeadSpyder’s job is to reveal those people. To turn “1,432 sessions” into “280 identified visitors” with names, companies, and SpyderScores your sales team can act on today. You already paid for the leads. LeadSpyder makes them visible.
See what your anonymous traffic is really worth. Start your first hunt here: https://leadspyder.ai/start
To go deeper on how identification works, read what is website visitor identification, and for the numbers behind the opportunity, see website visitor identification statistics.
No long contract. Fast setup. Live in under 10 minutes.